Tank Array Status

18 tanks. 16 growing. 2 becoming biodigesters.

Each tank has a water surface area of approximately 28.3 m² and a water volume of 28.3 m³. The array provides the biological proof-of-concept; commercial-scale feedstock for Phase 2 and beyond will come from leased farmland within each hub's cultivation radius, under DM-XTech's in-house cultivation teams.

Tank Array · Top View (hover for status)
Azolla cultivation (16 tanks)
Converting to biodigester (2 tanks)
A1
Tank A1 · Azolla · Dense mat
A2
Tank A2 · Azolla · Dense mat
A3
Tank A3 · Azolla · Establishing
A4
Tank A4 · Azolla · Active growth
A5
Tank A5 · Azolla · Active growth
A6
Tank A6 · Azolla · Establishing
A7
Tank A7 · Azolla · Dense mat
A8
Tank A8 · Azolla · Active growth
A9
Tank A9 · Azolla · Dense mat
B1
Tank B1 · Azolla · Establishing
B2
Tank B2 · Azolla · Active growth
B3
Tank B3 · Azolla · Dense mat
B4
Tank B4 · Azolla · Active growth
B5
Tank B5 · Azolla · Establishing
B6
Tank B6 · Azolla · Dense mat
B7
Tank B7 · Azolla · Active growth
BD1
Biodigester 1 · Converting · Gas infrastructure being fitted
BD2
Biodigester 2 · Converting · Gas infrastructure being fitted
Each circle = 1 tank · 6 m diameter × 1 m deep · ~28.3 m² surface area · ~28.3 m³ volume
Site Photographs · April 2026

From the ground. These tanks exist.

These photographs were taken at the DM-XTech pilot site. They document the current operational status of the azolla cultivation array and the biodigester conversion work in progress.

01 Dense azolla mat with near-complete surface coverage, DM-XTech pilot site Tank A Tank A · Dense Coverage
Figure 6.1 · Azolla Cultivation Tank A

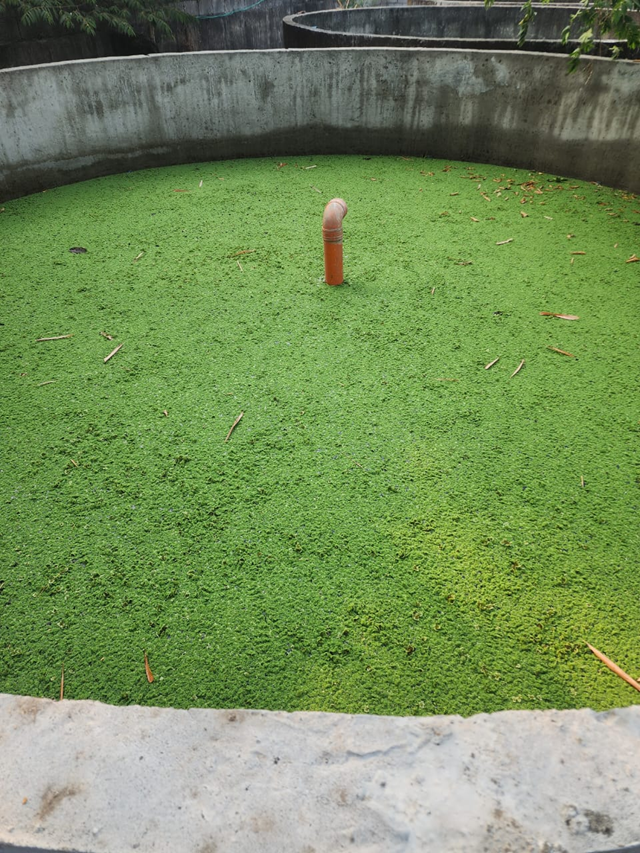
Dense mat — near-complete surface coverage

Uniform, dense Azolla pinnata canopy achieved under ambient Philippine tropical conditions — without supplemental nitrogen fertilizer, heating, or artificial lighting. The orange standpipe in the foreground serves as a central water-level regulator and harvest-access point. Multiple additional tanks are visible in the background, demonstrating the array scale. This represents the target mature state: full coverage indicating maximum biomass production rate ready for harvest and digester feeding.

02 Azolla establishing culture, early growth phase Tank B · Establishing Phase
Figure 6.2 · Azolla Cultivation Tank B

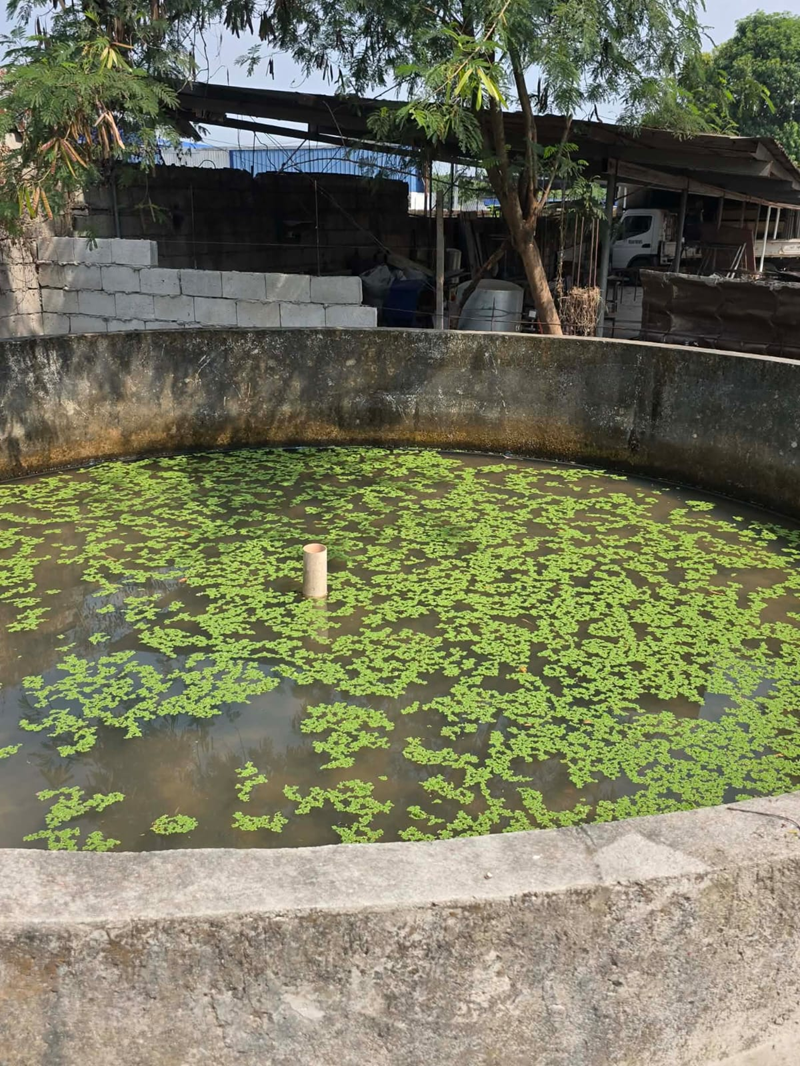
Early establishment — rapid colonization in progress

Partial surface coverage typical of the first 10–20 days after inoculation. Individual Azolla fronds are clearly visible floating on the open water surface. From this density, the fern will reach full mat coverage within 7–14 days under Philippine conditions, doubling biomass every 3–5 days. The concrete standpipe is visible at center — the simple, low-cost infrastructure that regulates water depth across the entire tank array. This tank progression directly demonstrates the predictable, reliable growth cycle that underlies DM-XTech's production model.

03 Tank being converted to biodigester with blue gas piping Biodigester Conversion · In Progress
Figure 6.3 · Biodigester Conversion (Tank BD1)

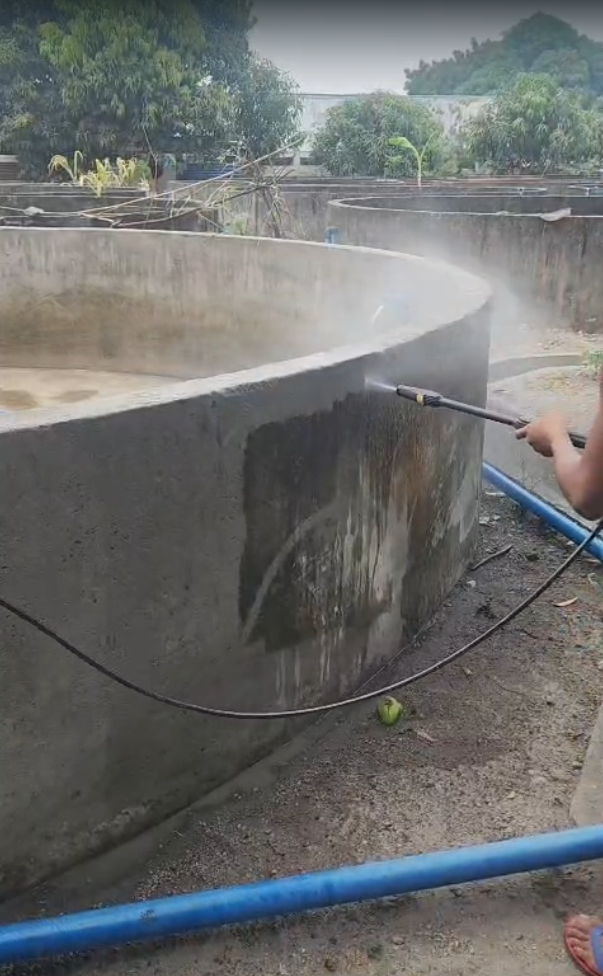
Infrastructure installation — gas collection ring visible

One of the two tanks being converted from azolla cultivation to a sealed anaerobic biodigester. The blue HDPE gas collection ring running inside the perimeter of the tank is clearly visible, along with connection fittings and the inlet pipe at the tank wall. This tank will receive harvested, chopped azolla biomass as substrate, and will be sealed with a gas-collection dome to capture the 50/50 CH₄/CO₂ biogas mixture produced during anaerobic digestion. The gas collection infrastructure shown here is the physical proof-of-execution for the biogas production phase of the DM-X CBM chain.

04 Good azolla coverage with white standpipe, second tank in background Tank D · Good Coverage
Figure 6.4 · Azolla Cultivation Tank D

Strong mat development — multiple-tank array context

Good Azolla coverage demonstrating healthy mat development, with a white concrete standpipe at center. A second cultivation tank is visible in the background, illustrating the multi-tank array configuration and the compact land footprint of the pilot site. The consistency of growth across multiple tanks — visible in this photograph — is central to DM-XTech's ability to project reliable daily biomass supply to the biodigesters. Azolla at this density is ready for the first harvest cycle, which will be repeated on a 2–3 week rotation to maintain continuous feedstock supply.

What the Pilot Proves

De-risked. Already operational.

  • Philippine tropical conditions support dense mat formation without supplemental heating, lighting, CO₂ enrichment, or synthetic nitrogen fertilization — confirming the theoretical productivity advantage across all 18 tanks.
  • The concrete circular format is effective at containment and management — protecting cultivation from wind, birds, and debris. The 6m diameter provides optimal surface-area-to-perimeter ratio for cost-effective construction and easy harvest access.
  • No disease pressure, pest colonization, or algal bloom contamination observed over multi-month operating periods, confirming robust Anabaena azollae symbiosis and resilience under Philippine ambient conditions.
  • Gas infrastructure conversion is straightforward — the biodigester conversion photographs confirm that standard HDPE plumbing components can retrofit the concrete tank design with minimal modification.
  • The capital is substantially already deployed — 18 concrete tanks have been constructed; 16 planted with azolla and 2 being converted to sealed biodigesters. The bank loan requested is to complete the gas processing chain (scrubbing, compression, cylinder filling), not to prove the biomass production concept.
Pilot Technical Parameters
ParameterValue
Total tanks constructed18
Azolla cultivation tanks16
Biodigester tanks (converting)2
Tank dimensions6 m Ø × 1 m deep
Each tank surface area28.3 m²
Each tank volume28.3 m³
Total digester volume (2 tanks)~56.6 m³
Hydraulic retention time25–30 days
Raw biogas composition~50% CH₄ / ~50% CO₂
Target biomethane purity (post-PWS)≥97% CH₄
H₂S residual (odorant)~50 ppm
CBM cylinder fill pressure200 bar(g)
Tank constructionReinforced concrete, cast in-situ
Site locationMetro area (pilot) · Bicol (Phase 3)

Loan readiness: The pilot site investment (18 concrete tanks) is already completed from proponent equity. The bank loan of ₱12,000,000 is specifically to fund the gas processing infrastructure — PWS scrubber, CBM compressor, cylinder filling station, and instruments — that converts the existing biogas resource into marketable DM-X CBM product.

After Loan Drawdown · 12-Month Plan

From loan approval to first CBM cylinder in under 8 months.

The commissioning plan below describes the sequence of activities from Month 0 (loan drawdown) through Month 12 (steady-state ramp). Every activity is standard for an anaerobic digestion plus pressurised-water-scrubbing plus high-pressure compression installation — no custom tooling, no novel engineering, and no unproven process steps. Equipment vendors are prequalified; the only gating variable is delivery lead-time.

Phase 1 Commissioning Gantt · Month 0 through Month 12

Month 0 = loan drawdown · Month 12 = steady-state operations
M0
M1
M2
M3
M4
M5
M6
M7
M8
M9
M10
M11
M12
M0–M3 · Procurement
Equipment ordered & site prep
  • Final specification sign-off with vendors
  • PWS scrubber skid ordered (lead time ~12 weeks)
  • K-102 4-stage compressor ordered
  • Civil works — compressor pad, pipe racks
  • Biodigester sealing & gas dome installation on BD1 & BD2
M3–M5 · Installation
Mechanical & electrical fit-out
  • PWS skid set-to-pad & piped up
  • Compressor installed with intercoolers
  • V-105 flash tank & V-106 caustic scrubber positioned
  • V-104 twin-tower dryer installed
  • Cylinder filling manifold & safety interlocks
M5–M7 · Commissioning
Cold & hot commissioning
  • Pressure & leak tests on all gas lines
  • First biogas from biodigesters (≥50% CH₄)
  • PWS operation trials · CO₂ removal tuning
  • Target ≥97% CH₄ purity confirmed
  • Compressor ramp to 200 bar
M7–M9 · First Output
First CBM cylinders filled
  • Cylinder filling trials (weight & pressure QA)
  • First commercial cylinder delivery
  • Customer route and logistics finalized
  • Operator training complete
  • Revenue generation begins
M9–M12 · Ramp
To steady state
  • Gradual output increase to nameplate
  • Feedstock logistics optimization
  • 82% utilization target
  • Full debt service begins (M12 end of grace)
  • First annual audit & carbon credit filing
Bank deliverable at Month 8 First commercial cylinder fill is the hard milestone the bank monitors. Once demonstrated, the project transitions from construction risk to operational risk — materially lowering the bank's exposure profile. Thereafter the standard DSCR covenants apply.
Expected Output · Year 1 Ramp

What the pilot will actually produce.

Once the gas processing chain is commissioned (Month 8), CBM cylinders begin flowing. The ramp below shows expected monthly output across Year 1 — deliberately conservative relative to nameplate, reflecting the realistic ramp of a newly-commissioned plant. Year 2 reaches the standard-hub steady state of 82% utilization (360,000 Nm³/yr) that underpins the financial model in economics.html.

Year 1 Monthly CBM Output Ramp (Nm³/month)

Ramp-up months
Near-steady months
Cumulative cylinders
0 10k 20k 30k 40k Nm³ CBM / month 0 5k 10k 15k 20k Cumul cylinders M1 M2 M3 M4 M5 M6 M7 M8 M9 M10 M11 M12 M0–M7 · Construction & commissioning (no output) M8–M12 · Operational ramp First commercial cylinder Year 1 monthly CBM output · M0 = loan drawdown
~82,000Nm³
Year 1 total CBM
Conservative; 5 months of partial operation after M8 first-fill. Approximately 23% of full-year steady-state output.
~8,200cyl
Cylinders filled · Year 1
50-litre cylinders at 200 bar · each containing ~10 Nm³ CBM equivalent to ~8 kg LPG per cylinder.
~₱4.3Mrev
Year 1 gross revenue
At ₱52/Nm³ BTU parity with LPG · equivalent to ₱715/cylinder average retail.
Y2 Steadystate
Year 2 reaches 360k Nm³
82% utilization of 50 Nm³/h nameplate · equals 287 MT LPG displaced · financial model steady-state reference.
Ramp profile is deliberately conservative — actual ramp may be faster if commissioning trials complete ahead of schedule. The Year-1 DSCR of 2.43× in economics.html already accounts for this partial-year operation plus the 6-month principal grace period. Year 2 (first full operating year) is the binding DSCR year at 1.41×.
Scale Bridge · Phase 1 → 2 → 3

From 18 tanks to a national programme.

The pilot is not the endpoint — it is the first stage of a three-phase progression. Each phase de-risks the next: the pilot proves the biology and process chain; the Phase 2 standard hub proves commercial economics; the Phase 3 Bicol site proves replication at regional scale. The financial model in economics.html is anchored on Phase 2 metrics; Phases 3 and 4 extend the same unit economics across more hectares.

Phase 1
Urban Pilot
2026 · 18-tank site · ₱17M total CAPEX
Footprint~0.05 ha (18 × 28.3 m²)
Feedstock source16 in-house tanks + local leased land
Nameplate capacity~50 Nm³/h (ramping)
Year 1 CBM output~82,000 Nm³
Year 2 steady-state~360,000 Nm³
LPG displaced (Y2)~287 MT/yr
Households served~2,000 HH
PurposeProve biology and gas chain · commission engineering design · generate first CBM revenue · establish lease and cultivation workflows.
Phase 2
Standard Hub · Replicable
2027–2031 · 25 hubs · province-level deployment
Footprint (per hub)114 ha leased land
Feedstock sourceLeased farmland within 8 km
Nameplate capacity50 Nm³/h per hub
Year-1 CBM output~360,000 Nm³ at steady state
25-hub network~9.0M Nm³/yr combined
LPG displaced (network)~7,175 MT/yr
Households served (network)~50,000 HH
PurposeProve commercial economics at the standard hub scale · replicate across provinces · build the distribution brand and cylinder logistics.
Phase 3
Bicol Scale-Up
2032–2035 · 525 ha site · regional-scale proof
Footprint525 ha contiguous cultivation
Feedstock sourceProponent-owned Bicol site
Processing nameplate~230 Nm³/h (4.6× standard hub)
Annual CBM output~1.65M Nm³
LPG displaced~1,319 MT/yr
Households served~10,000 HH
Indicative Phase 3 CAPEX₱800M – ₱1.2B
PurposeProve regional-scale replication · attract DFI / strategic co-investment · unlock VER off-take at scale · validate a template for 100+ hubs nationally.
🌾
The pilot is step 1 of 3 — and each step funds the next. Phase 1 is 100% private proponent equity + a ₱12M commercial bank loan. Phase 2 is funded from Phase 1 cash flow plus follow-on commercial financing. Phase 3 is funded by a mix of cumulative operating cash flow, DFI / strategic partner capital, and VER off-take agreements. The bank's Phase 1 loan underwrites the step that proves every subsequent step is possible.
Phase 3 figures assume uniform 150 t/ha/yr fresh azolla yield (conservative tropical baseline) and the same 47.6 kg azolla per Nm³ CH₄ conversion as used throughout the financial model. CAPEX range is indicative for Phase 3 scope including cultivation infrastructure, multiple digester trains, PWS scale-up, and multi-stage compression. Final Phase 3 CAPEX will be sized against actual Phase 1/2 cash flow performance.